TL;DR
Your payment processor captures every authorization, decline, void, refund, and chargeback at the terminal, BIN, and cashier level. Most retailers pull only a monthly summary and miss the patterns that expose theft. The fix is to request 90 days of transaction-level data, segment refunds by employee ID, audit voids in the last 5 minutes of each batch window, and flag any cashier whose refund-to-sales ratio runs more than 1.5 standard deviations above store average. The data is already paid for and already sits in your gateway portal.
What this actually is
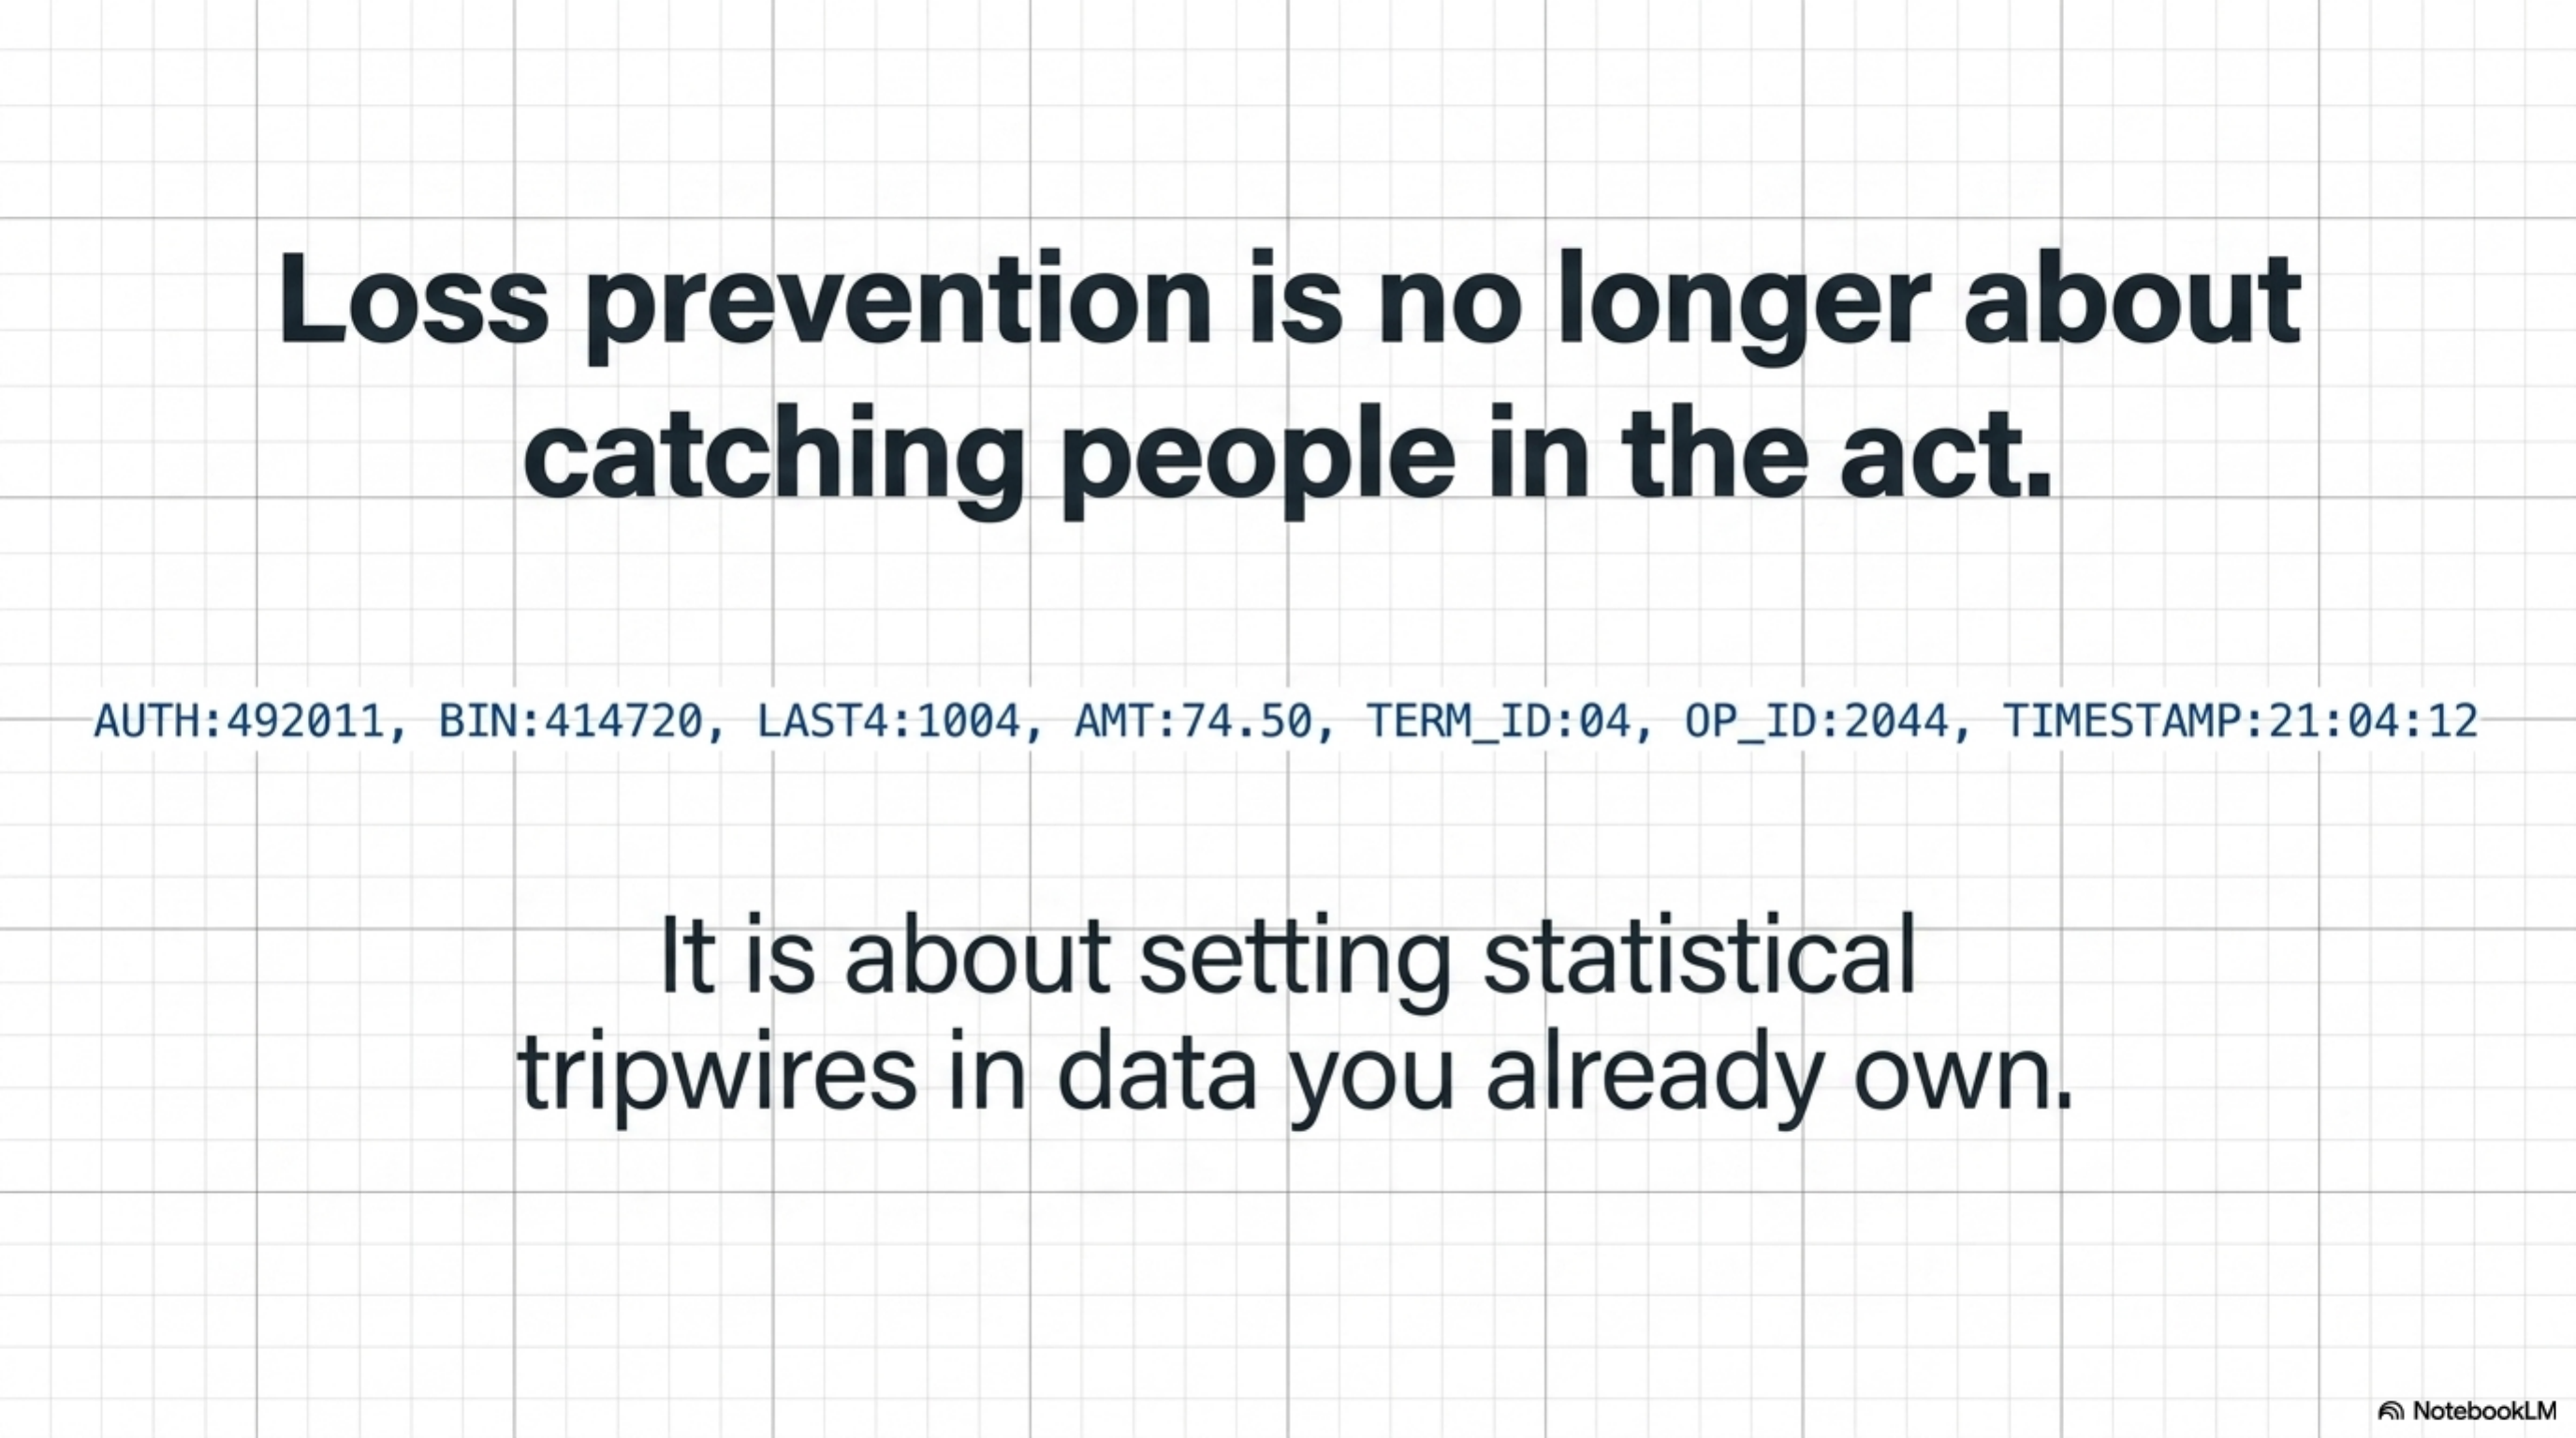
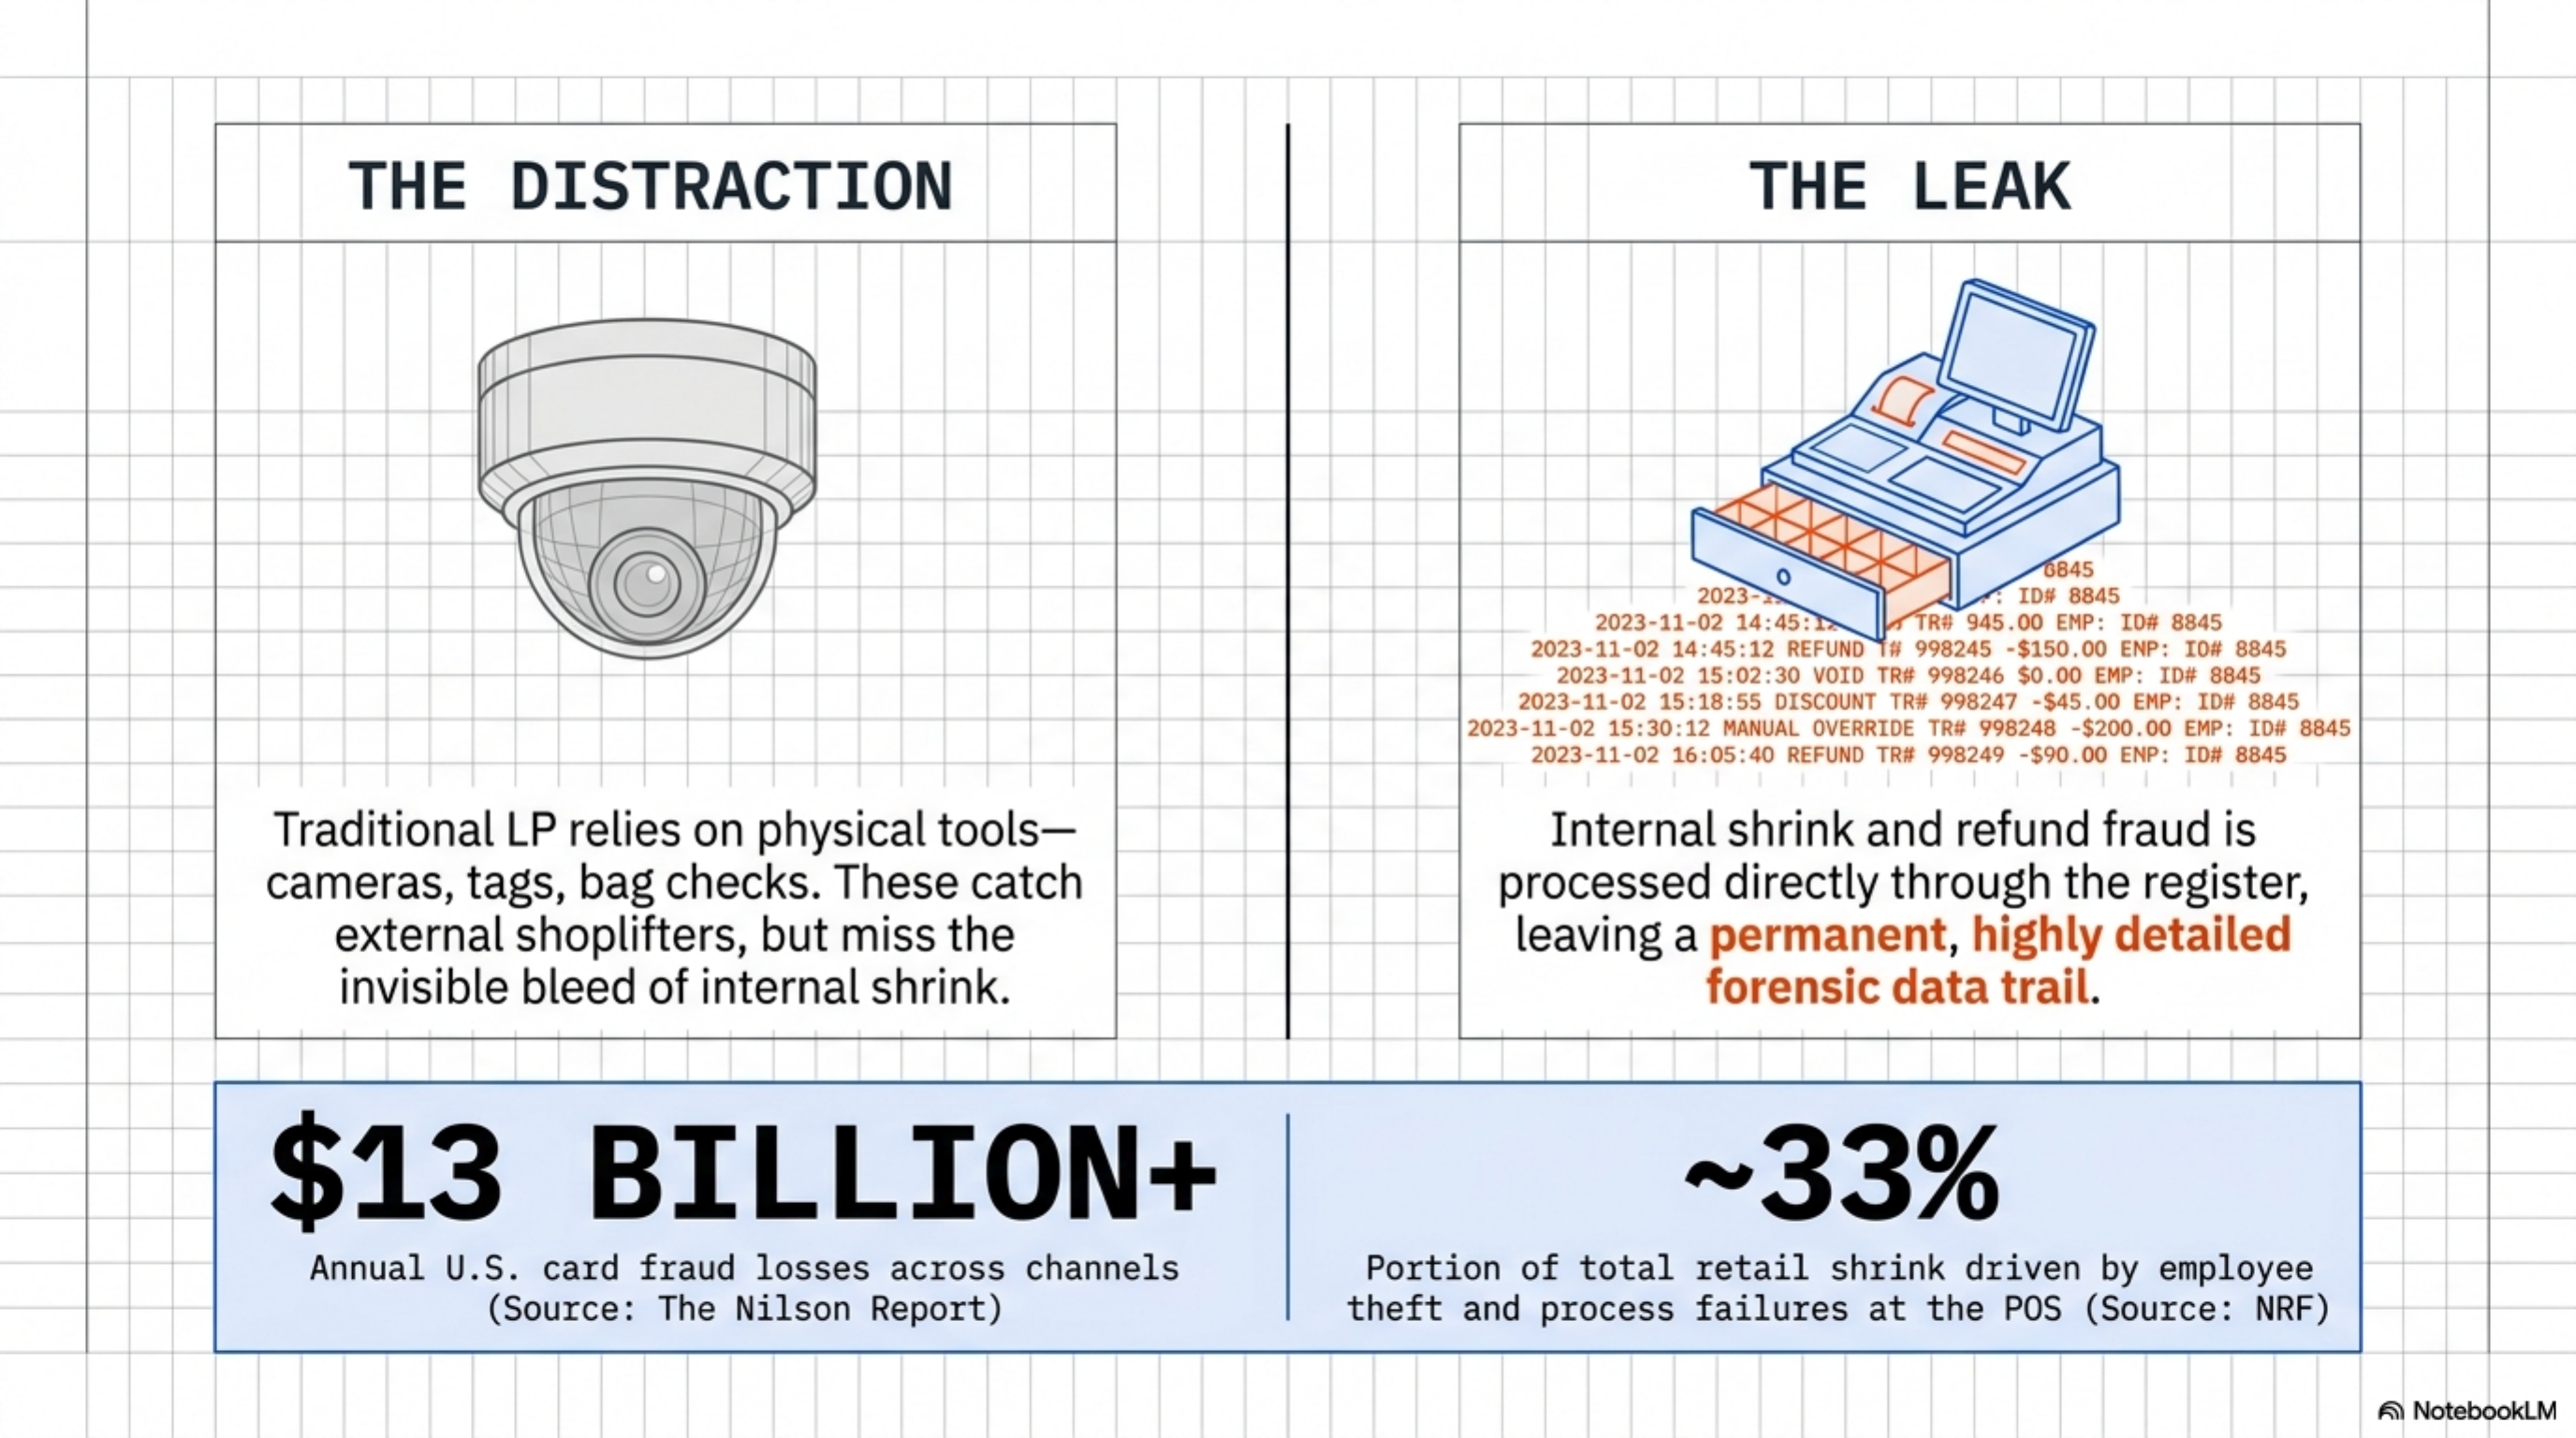
Loss prevention in retail historically meant cameras, security tags, mirrors at the back of the store, and bag checks at the door. Those tools catch external shoplifting. They do not catch the larger problem: internal shrink and refund fraud at the register.
The National Retail Federation's annual shrink reports have for years put employee theft and process-failure shrink at roughly a third of total losses. The bulk of that movement touches the point-of-sale system. Cash drawer manipulation, fake refunds processed to a personal card, voiding a paid ticket and pocketing the cash, ringing comp transactions for friends and family, and gift card balance manipulation all leave records in payment processor data.
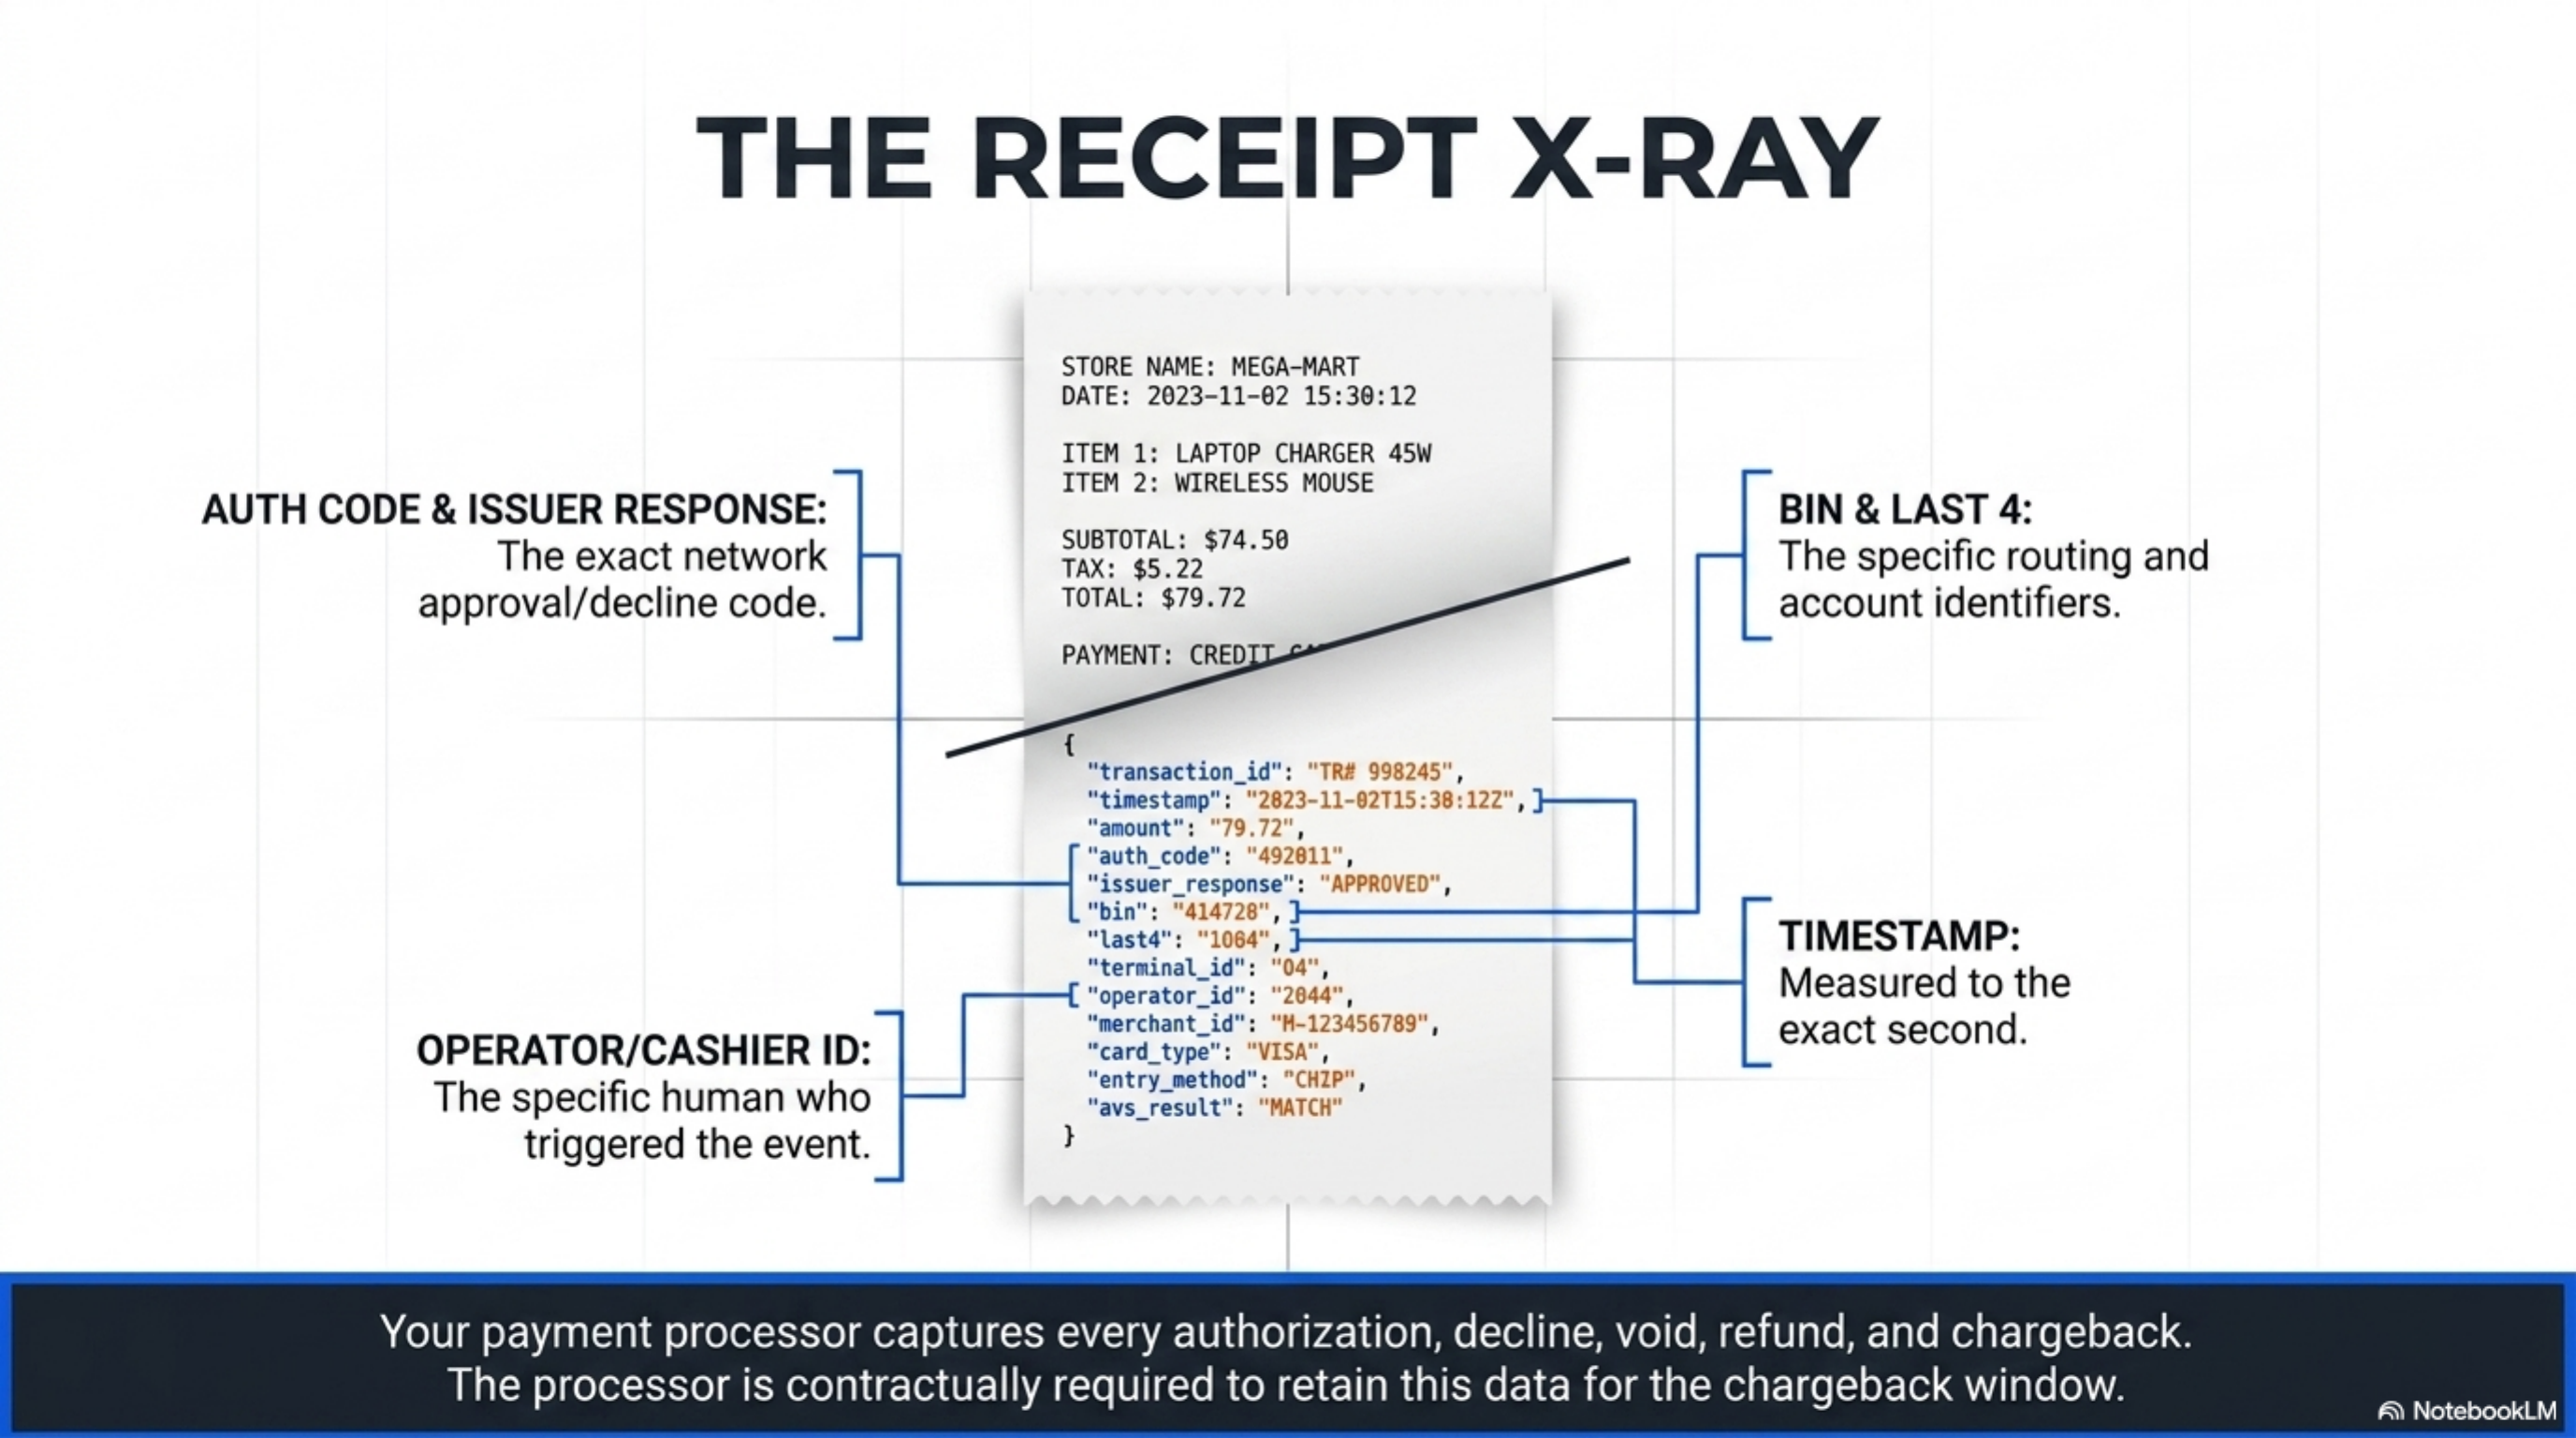
Every card swipe, dip, or tap creates a row. The processor logs the auth code, the BIN, the last four digits, the device ID, the cashier or operator ID if the POS forwards it, the timestamp to the second, and the response from the issuer. Refunds carry the same metadata plus a reference to the original sale, or a flag indicating no original reference exists. Voids carry the user ID and the elapsed time between auth and cancellation. Chargebacks land later with reason codes defined by each card network.
The Federal Reserve payments studies document the structure of U.S. card flows at a national level. The Visa interchange schedules and Mastercard interchange materials define what data each transaction must carry to qualify for each rate category. The Nilson Report tracks aggregate U.S. card fraud losses, which have crossed $13 billion in recent years across card-present and card-not-present channels.
This is not analytics in the marketing sense. It is forensic accounting using data your processor already collected and is contractually required to retain for the chargeback response window.
Retail loss prevention through processor data is the practice of analyzing authorization, refund, void, and chargeback records from your payment processor to detect employee theft, refund fraud, and external card abuse.
How it works under the hood
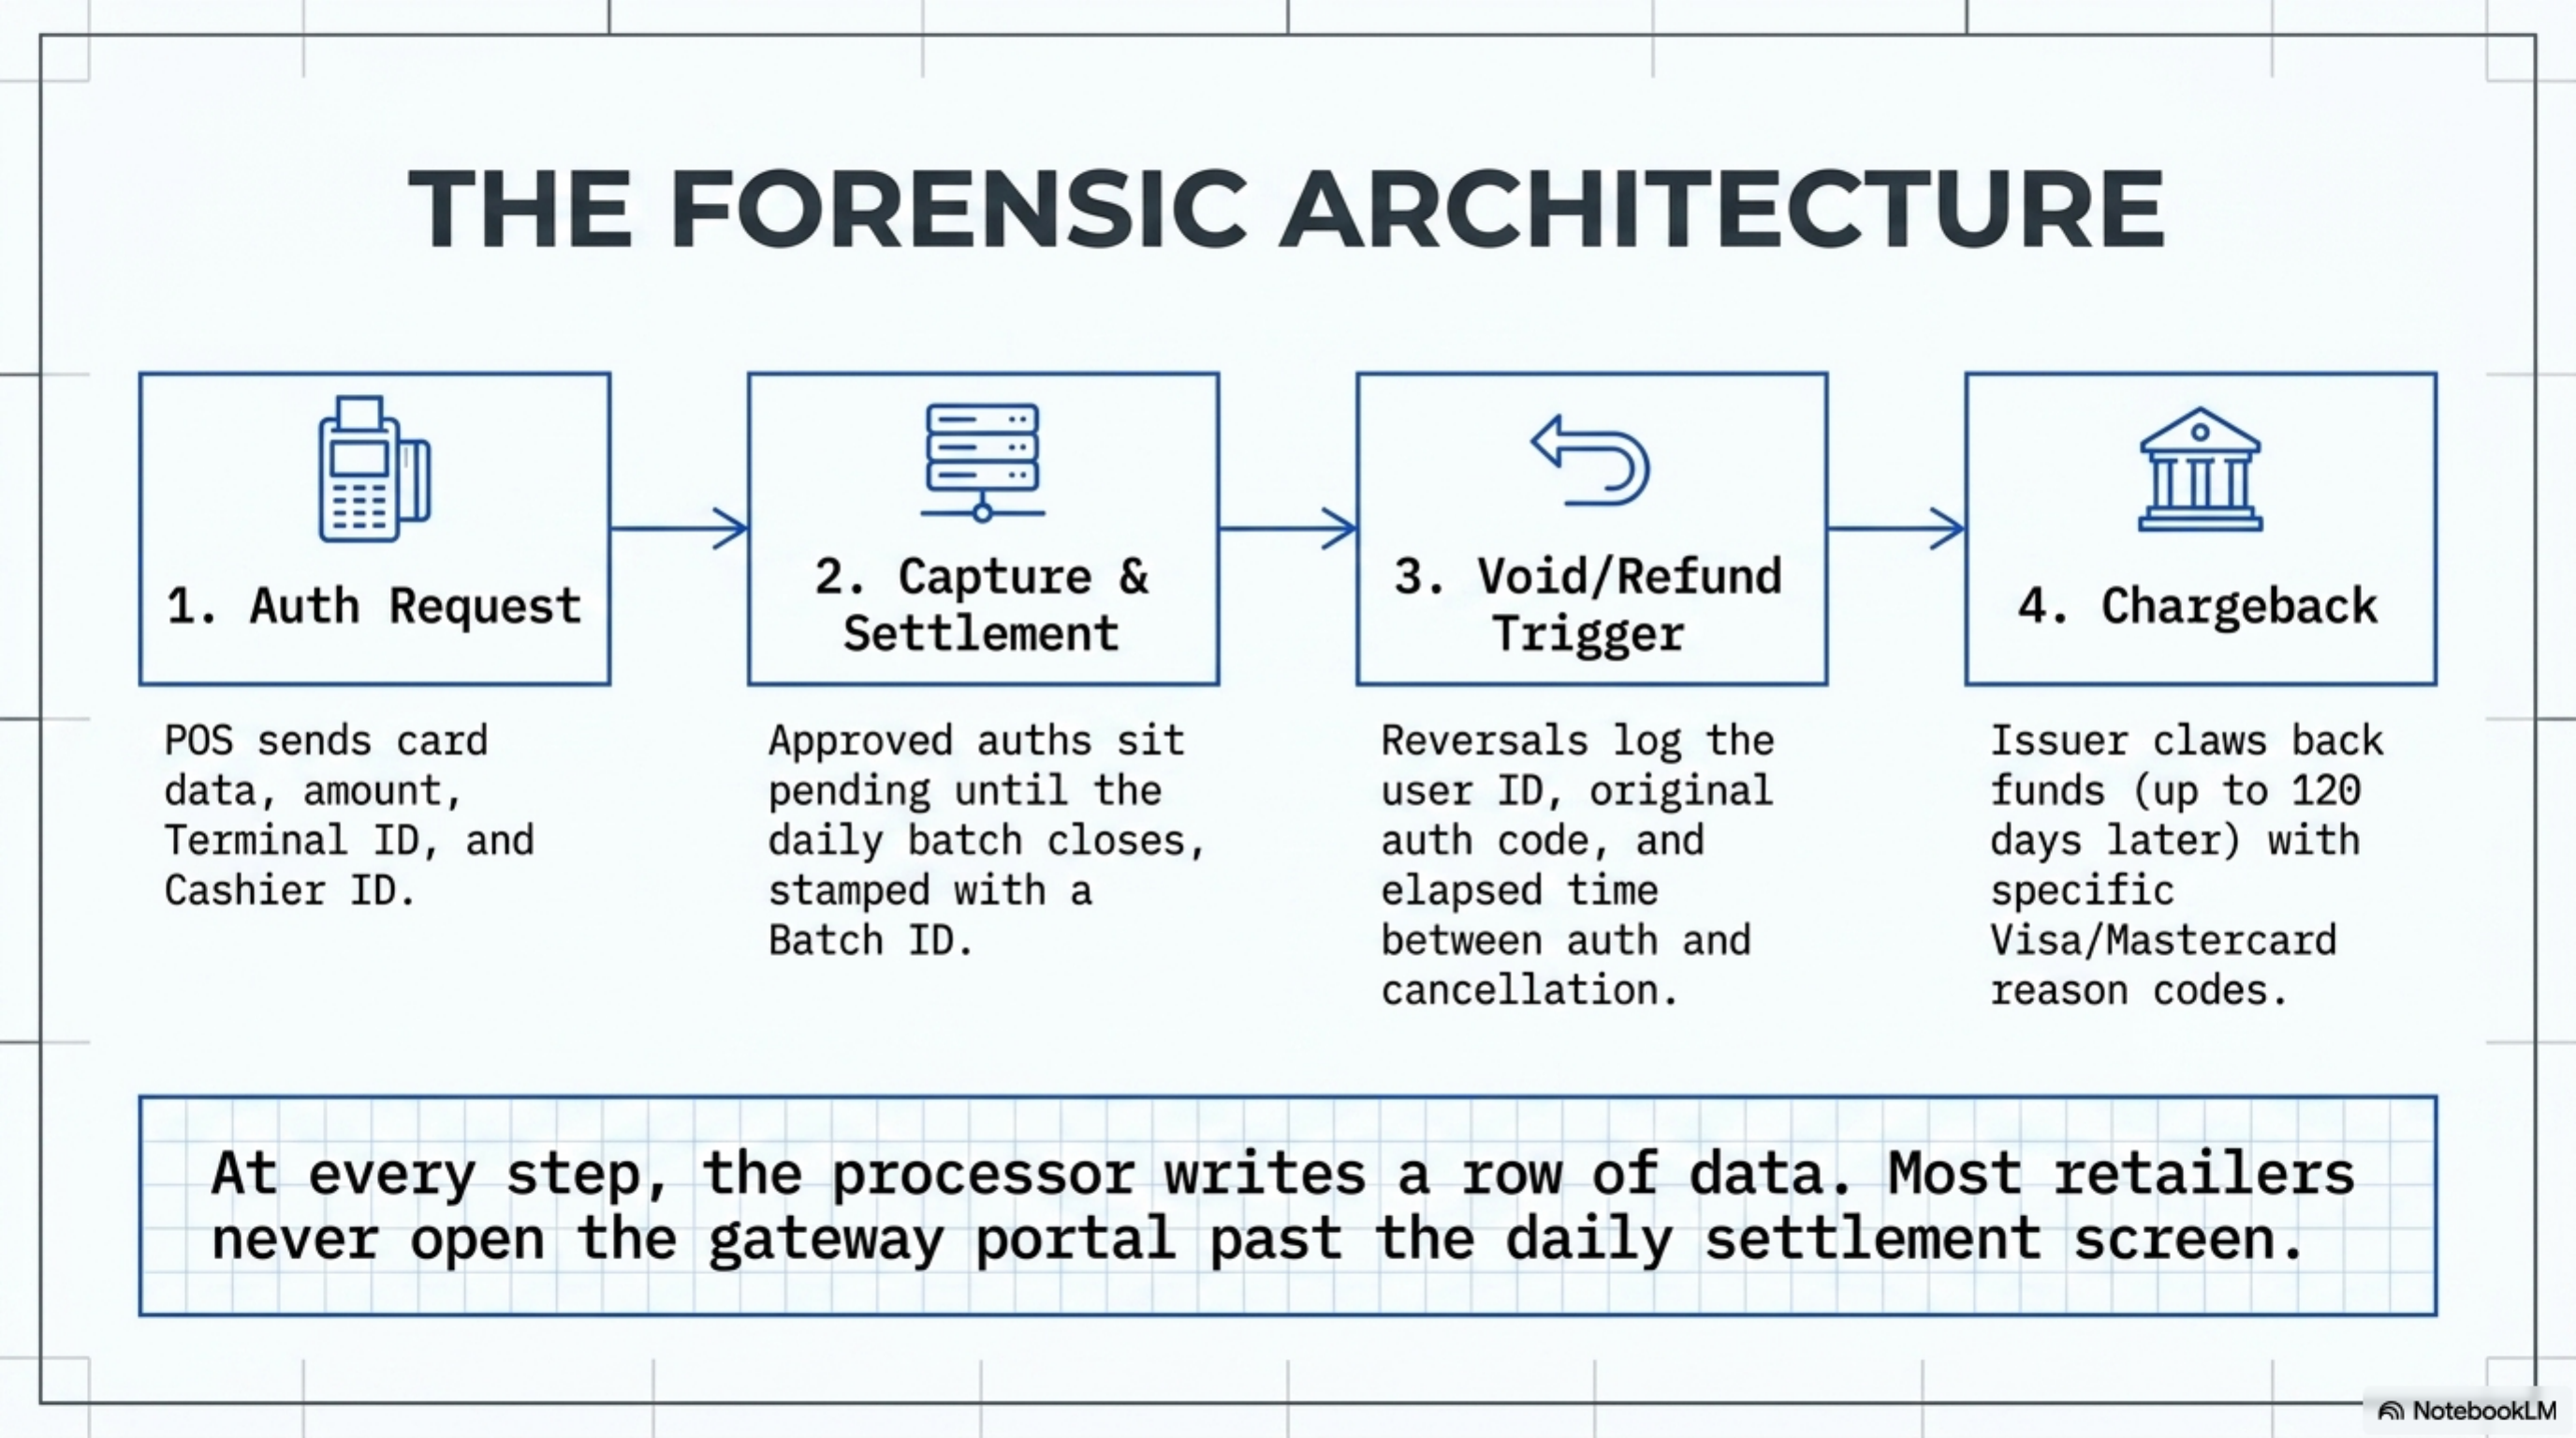
The processor sits between your point-of-sale terminal and the card networks. Every retail transaction follows a defined flow, and at each step the processor writes a record you can pull later.
- Authorization request. The POS sends card data, transaction amount, merchant ID, terminal ID, and (if configured) the cashier or operator ID. The processor forwards the request to the network, which routes it to the issuing bank.
- Authorization response. The issuer returns an approval code or a decline reason code. Both are logged. Approved auths sit in a pending state until the batch closes that day.
- Capture and settlement. At day-end batch, approved auths are submitted for settlement. The processor packages them with a batch ID, batch timestamp, and cumulative total.
- Void. If a transaction is canceled before settlement closes, the void is recorded with the user ID that triggered it, the original auth code, the original timestamp, and the elapsed time between auth and cancellation.
- Refund. A refund credits a card. The processor logs the cashier ID, the destination card BIN and last four, the amount, and a reference to the original sale, or a flag indicating the refund was entered without an original transaction reference, the so-called manual refund path.
- Chargeback. The issuer can claw back funds up to 120 days later under Visa or Mastercard reason codes. The processor delivers the notice with the reason code, the disputed amount, the original transaction reference, and a response deadline (usually 7 to 14 calendar days).
The data lives inside the gateway portal your processor activated at signup. Most retailers never open it past the daily settlement screen. The CSV export is free at most acquirers and usually retains 12 to 18 months of history. Merchants above roughly $500,000 monthly volume can request an SFTP feed or a reporting API with the same fields delivered nightly.
Inside the export, each row carries 30 to 60 fields. The ones that matter for loss prevention: auth code, transaction type (sale, void, refund, chargeback), card BIN, last four, amount, currency, terminal ID, operator ID, original transaction ID for refunds and voids, settlement batch ID, settlement timestamp, issuer response code, AVS result, CVV result, and the entry mode (chip, swipe, contactless, keyed, e-commerce).
Where it goes wrong for operators
Five patterns dominate processor data when fraud or internal theft is moving through the register.
1. Refund-to-sales ratio by employee. A specialty retailer's store-level refund rate typically sits between 1.5 and 2.5 percent of sales. One cashier running at 4.5 percent is either processing cash returns and keeping the cash, or running fake refunds to a personal card. At $1,500 daily sales per cashier, a 2.5 point gap is $37.50 per day, or $13,700 per year, from a single register. At a 25-cashier chain, even three or four outliers move the annual loss past $50,000.
2. Voids in the closing window. A void at 9:02 PM when the batch closed at 9:00 PM is normal. It is a customer changing their mind. A pattern of voids in the final 5 minutes before batch close, across multiple drawers or one drawer repeatedly, is not. This usually flags an employee voiding a paid cash ticket so the drawer balances while the cash walks out the door. A weekly pattern of 4 to 6 closing-window voids at one terminal is the leading indicator.
3. Same-card refund magnet. The same destination card, matched by BIN and last four, receiving refunds initiated by multiple cashiers in the same week is almost always an employee's personal card, a spouse's card, or a card belonging to a regular accomplice. At a $50 average refund and 3 hits per week, that is $7,800 per year per ring, and these schemes often run for 18 months before someone notices.
4. Card-present chargeback clusters. Visa reason code 10.4 (fraud, card present, EMV) and 13.1 (services not provided) sometimes cluster by zip code, BIN range, or SKU. A single zip producing 15 percent of card-present chargebacks against 2 percent of sales volume signals either a local fraud ring or a compromised cashier who is processing real cards while skimming the magstripe data. The pattern is visible only when you cross-reference chargebacks against sales by zip.
5. Card testing and rapid declines. Sub-dollar auth attempts (often $0.01 or $1.00), repeated declines followed by an approval using the same card or device fingerprint, or sequential BINs from the same issuer in rapid succession all mean a stolen card is being validated at your terminal before a larger purchase. The processor logs every attempt, including the declines that the cashier and POS may not surface on the receipt printer.
One cashier ringing $720 daily in unreferenced refunds is a $74,000 per year leak. The data to find that cashier already sits in your gateway.
Worked example with real numbers
Profile: Five-location specialty retailer in the U.S. Northeast. $2 million monthly card volume. $45 average ticket. Currently on tiered pricing at a 2.4 percent effective rate. Card-present transactions, mix of Visa, Mastercard, and American Express.
The loss prevention manager pulls 90 days of transaction-level data from the gateway. CSV export, 312,000 rows, delivered in 9 minutes. Imports into a spreadsheet, filters for refunds, buckets the result by cashier ID and store ID.
Store-level refund rates after the pull: Store 1 at 1.7 percent, Store 2 at 2.1 percent, Store 3 at 1.9 percent, Store 4 at 2.0 percent, Store 5 at 3.9 percent. Store 5 is the outlier by a wide margin.
Drilling inside Store 5 to cashier-level refund volume, one closer accounts for 62 percent of total refunds, with $720 in average daily refund value. The other six cashiers at that store run between 4 and 12 percent of refund volume each. The closer also works the only shift where no manager is on the floor for the final two hours.
Pulling the original sale references on the closer's refunds: 48 percent are flagged as refund without receipt, entered manually with no reference to an original transaction. Industry benchmark for unreferenced refunds is under 5 percent of refund count.
The math: $720 daily refund volume x 30 days x 12 months = $259,200 annualized refund flow originating with one cashier. If 60 percent of the unreferenced portion is fraudulent (the cashier processing a fake return to a personal card, or a complicit shopper returning items pulled from the sales floor), the leakage is approximately $74,650 per year from one register.
That is only the internal slice. The same data pull surfaced three card-present chargeback clusters tied to one shipping zip code, totaling $11,400 across 90 days. All under Visa reason code 10.4. Filed by three different issuing banks within a 6-week window. The cluster pattern is consistent with card data being skimmed at the terminal and re-encoded for purchase elsewhere, which would point investigation back at the same closer.
The processor sends the same dataset every month. The difference between catching $75,000 in fraud and missing it is whether anyone in operations opens the file.
Operator playbook
- Pull a 90-day transaction-level extract from your gateway. CSV format, free at most processors. Request these fields at minimum: auth code, transaction type, card BIN, last 4, amount, terminal ID, employee or operator ID, original transaction reference, void flag, batch ID, settlement timestamp accurate to the second, entry mode, and response code.
- Calculate refund-to-sales ratio by employee and by store. Flag any employee running more than 1.5 standard deviations above store mean. Pull vertical peer benchmarks from your processor under NDA. Most large acquirers publish them on request and the request itself signals that you are watching.
- Audit voids in the final 5 minutes of each batch window. Pull every void where the elapsed time between original auth and void is under 10 minutes. Cross-reference against shift logs and security camera time-stamps. A pattern of 4 or more closing-window voids per week at one terminal is the action threshold.
- Match refund destination cards to employee on-file cards. Pull BIN and last four for the credit card receiving each refund. Compare to the card-on-file list HR or payroll holds for direct deposit and for tipped-staff prepaid cards. Some processors block this comparison by policy. Ask in writing.
- Subscribe to chargeback alert networks. Verifi CDRN and Ethoca Alerts are the two main networks. Each costs $0.40 to $1.00 per alert. They let you refund the disputed transaction before the chargeback files, which avoids the $15 to $40 chargeback fee, the time cost of writing a response, and the hit to your chargeback ratio with the card networks.
- Configure manager approval for refunds over a threshold. Set the floor at $50 to $100 depending on average ticket. The setting is free in any modern POS. Published retail case studies show this cuts unreferenced-refund fraud by 60 to 80 percent because the cashier can no longer act alone.
- Pull chargeback reason codes monthly. Map results by zip code, BIN, and SKU. If a single SKU drives more than 15 percent of fraud chargebacks, tighten CVV or AVS rules for that SKU, or restrict the sales channel until the pattern clears.
- Move from tiered pricing to interchange-plus. Tiered statements hide the actual interchange category for each transaction. Interchange-plus statements show every category code, which is the data you need both for forensics and for verifying that the processor is passing through real interchange rates instead of marking up the qualified bucket.